You are here
Preliminary HVSR analysis historical ferrara centre
Abstract
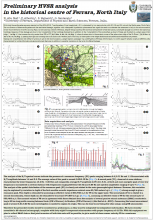
Following the earthquake sequence started on May 20th 2012, 7 earthquakes of local magnitude > 5.0, culminated by two main shocks with Ml: 5.9 and 5.8, struck the Emilia area, North Italy. The occurrence of these earthquakes and the associated damage, together with widespread liquefaction phenomena has urged the need to accelerate the measures to help in the microzonation of the whole territory of the Po Alluvial Plain. In the historical centre of Ferrara, despite being located at 30 km from the epicenter of the first shock, noticeable damage occurred to the historical buildings. Reasons of this damage are due to the vulnerability of the buildings themselves in addition to the vulnerability of the subsurface as most of these are founded on a small paleo-river ridge (* in Fig. 1) that crosses the city centre from NE to SW (H/V Nos. 5, 20, 18, 19/Fig. 1) where it enters into to the ancient course of the paleo-river ridge of the Po River ((H/V Nos. 4, 19, 7, 13, 14, 10/Fig. 1) passing through and crossing the south and south-western part of the city. In these paleo-river ridges friable and saturated sand sediments are present. Taking into consideration the needs for actions to aid in the microzonation, a single station campaign was undertaken in Ferrara (North Italy), to collect passive seismic noise at different sites characterized by unlike lithologic and geomorphologic features in addition to sensible variations in the level of suffered damage. The analysis of the H/V spectral curves indicate the presence of a resonance frequency (F0) peaks ranging between 0.6/0.71 Hz and 1.1 Hz associated with H/V amplitude between 1.6 and 3.5. The average value of this peak is around 0.83±0.13 Hz (Fig. 4). A second peak (F1), observed at some stations, characterized by lower frequencies (0.4 Hz -0.59 Hz) and comparable average H/V amplitude to F0 (2.1-3.0). A third and more energetic peak of very low frequency is encountered in several stations with frequencies ranging between 0.21 Hz and 0.29 Hz and spectral amplitudes ranging of up to 7 (Fig. 3). The analysis of the spatial distribution of the resonance peak (F0) is clearly not related to the main geomorphological features. However, this variation may be explained by variation in depth of the first sensible acoustic impedance contrast some 80/120 meters b.g.l., (1/Fig. 2) strong enough to give a resonance peak. This depth is estimated by assuming an effective value of 200/340 m/s for VS in the upper layer. The second peak (F1) is related to a second discontinuity, whose depth can be estimated to be around 170/200 m b.g.l (2/Fig. 2), assuming an effective value of VS for the second layer of 350/400 m/s. The assumed values of VS are in agreement with those obtained from the analysis of several passive seismic antennas (ESAC) conducted a long a 20 km long profile running between Cento (SW of Ferrara) to Bondeno (NW of Ferrara) (Abu Zeid et al., 2013). Concerning the lowest encountered peak of around 0.21/0.29 Hz more investigation is needed to explain its origin. This can be done by surveying few sites using a using BB seismometer. Therefore the presented results should be considered as preliminary, as they must be integrated by independent information. We have recently assembled a 48-channel seismograph, complete with forty eight 3-component seismometers with proper frequency of 4,5 Hz. With this equipment we plan to collect ESAC data so that joint inversion of both data sets will be possible, to get a model of shear waves velocity VS to a maximum investigation depth of 200-250 m
